Is your money really going farther outside the Loop, or is the higher price per square foot inside the Loop worth it for your lifestyle and goals? If you are comparing homes across Houston, PPSF can be a helpful lens, but it is only one part of the valuation picture. You want a clear way to compare apples to apples without missing crucial details like lot value, renovations, or flood risk. In this guide, you will learn how PPSF works in Houston, why it differs between the Inner Loop and the suburbs, and the smart way to use it alongside comps to make confident decisions. Let’s dive in.
What PPSF means in Houston
Price per square foot, or PPSF, is a simple calculation: sale price divided by the finished living area. It is a unit price, not a complete valuation metric. In Houston, PPSF is sensitive to what is counted as living space and to features that are not included in square footage but still affect value.
Use PPSF for quick comparisons and sanity checks. Then layer in specific adjustments. This keeps you from overpaying for a shiny finish or overlooking a costly flood exposure that does not show up in square footage.
Why Inner Loop PPSF runs higher
Several local forces push PPSF up inside the 610 Loop.
- Land scarcity and lot economics. Lots are smaller and closer to job centers and amenities. Buyers often pay a location premium. Smaller homes on smaller lots tend to show higher PPSF even if the total price matches a larger suburban home.
- Walkability and amenities. Neighborhoods with walkable retail, dining, parks, and transit access often command higher per-square-foot values. Areas like Montrose, the Museum District, the Heights, Midtown, and West University benefit from this effect.
- Redevelopment demand. In sought-after pockets, buyers value the land for potential teardown and rebuild. When land value is high, PPSF rises even if the existing structure is modest.
- Neighborhood character and rules. Historic districts and prestige enclaves support premiums. School zone boundaries can also influence buyer demand in specific areas.
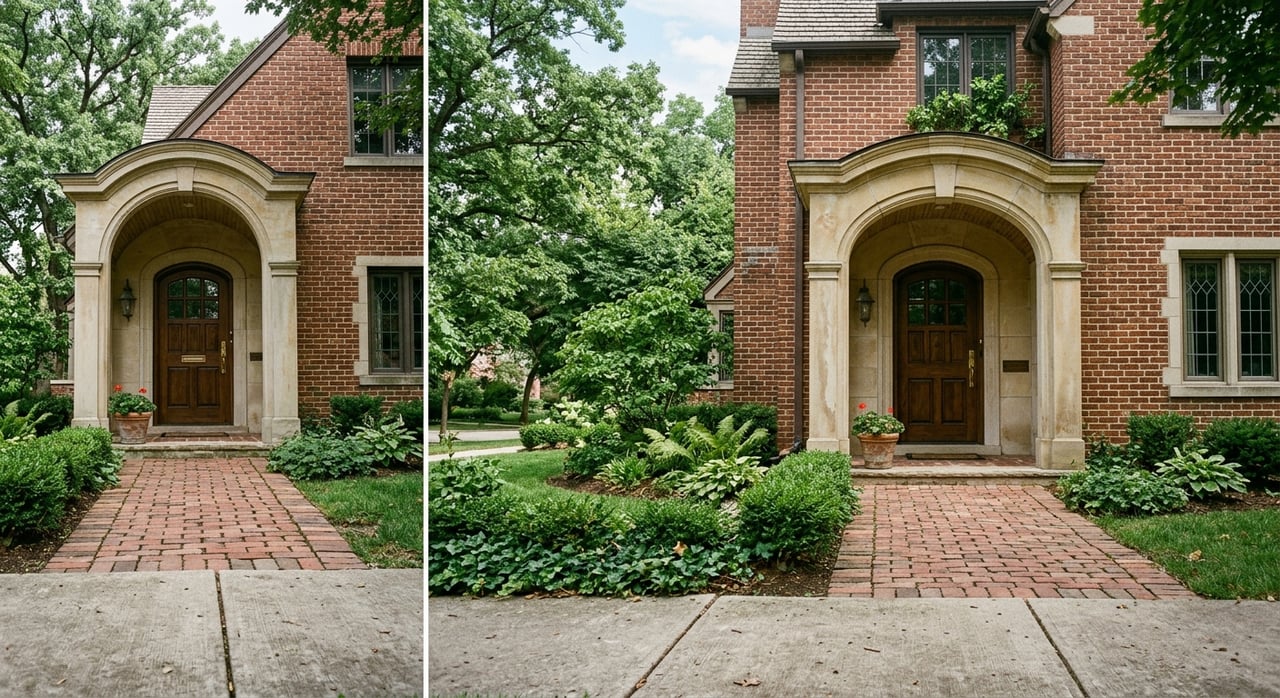
- Renovation level and age. A thoughtfully renovated older home near urban amenities can achieve a strong PPSF. An unrenovated property of similar size nearby may not.
- Flood risk differences. Flood history and elevation matter. Lower-risk or elevated lots can support higher prices, which lifts PPSF. Properties with higher flood risk typically sell for less, which lowers PPSF.
Why suburban PPSF is often lower
Suburban markets usually show lower PPSF for practical reasons.
- Larger homes and lots. A bigger denominator lowers PPSF. You may get more interior space per dollar even if the total price is similar to an Inner Loop home.
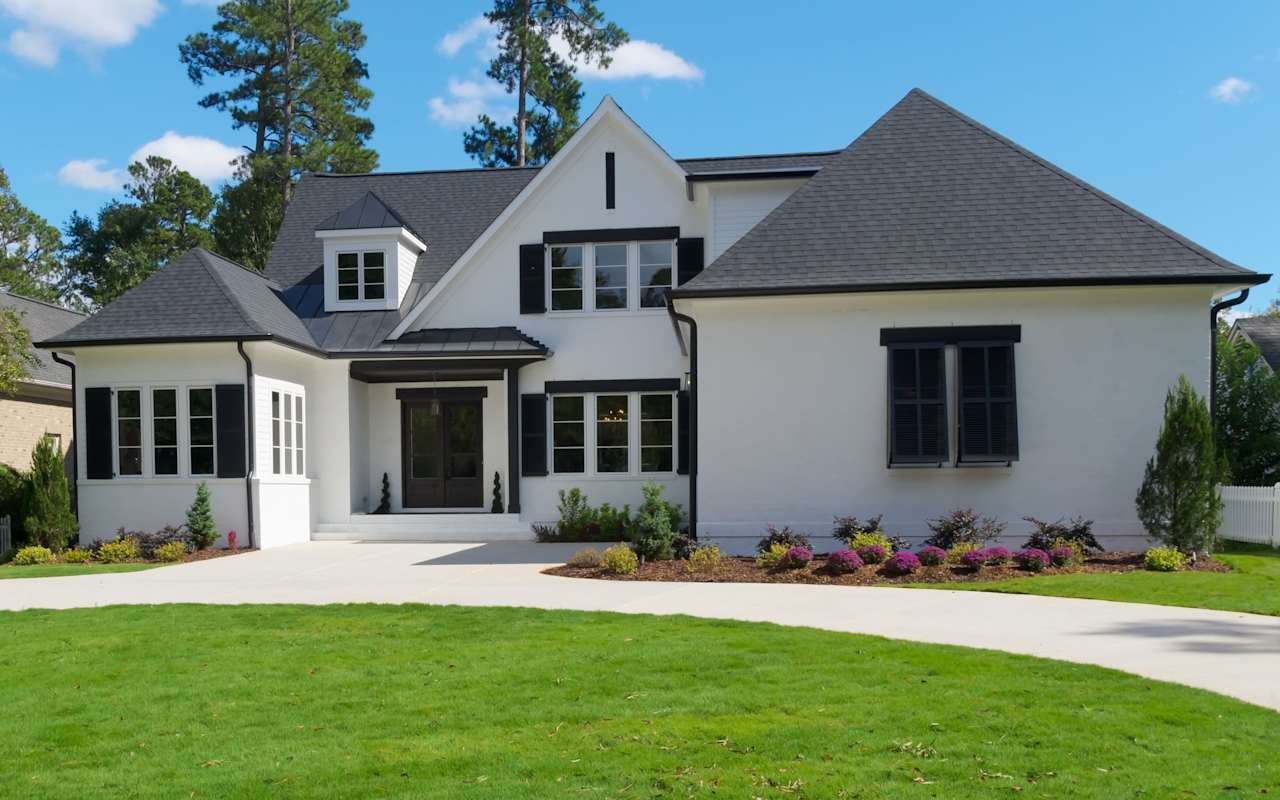
- Product mix and finishes. Many suburban areas offer newer tract-built homes with standardized finishes. That lowers the median PPSF compared with custom or extensively renovated inner-loop properties.
- Lifestyle and commuting tradeoffs. Buyers often prioritize lot size, privacy, or yard space relative to immediate urban amenities. That shifts where value is reflected.
- Market cycle and inventory. When new construction supply is strong, PPSF can be more stable or softer compared with tight, close-in neighborhoods.
Houston micro-markets at a glance
Inner Loop examples
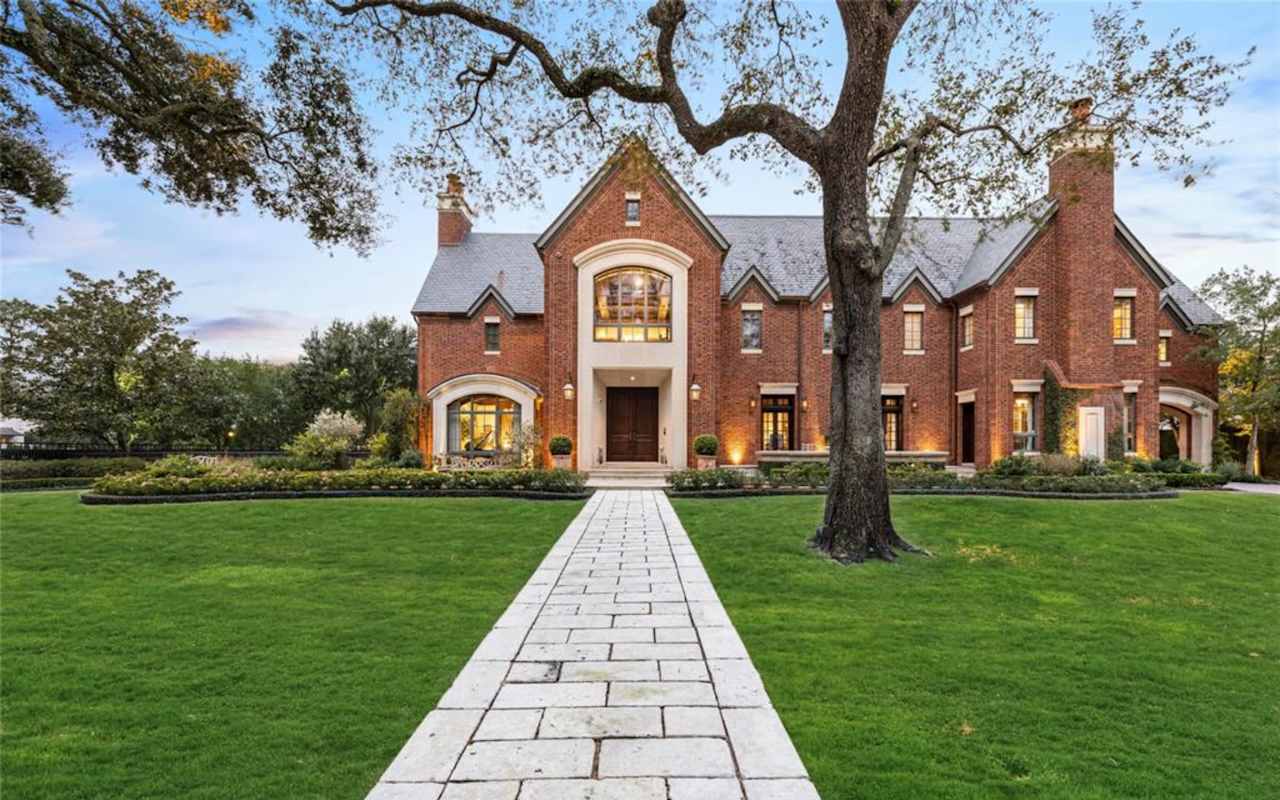
- River Oaks, Upper Kirby, West University, Bellaire. Smaller-lot pockets with prestige and strong location premiums. PPSF is often among the highest citywide.
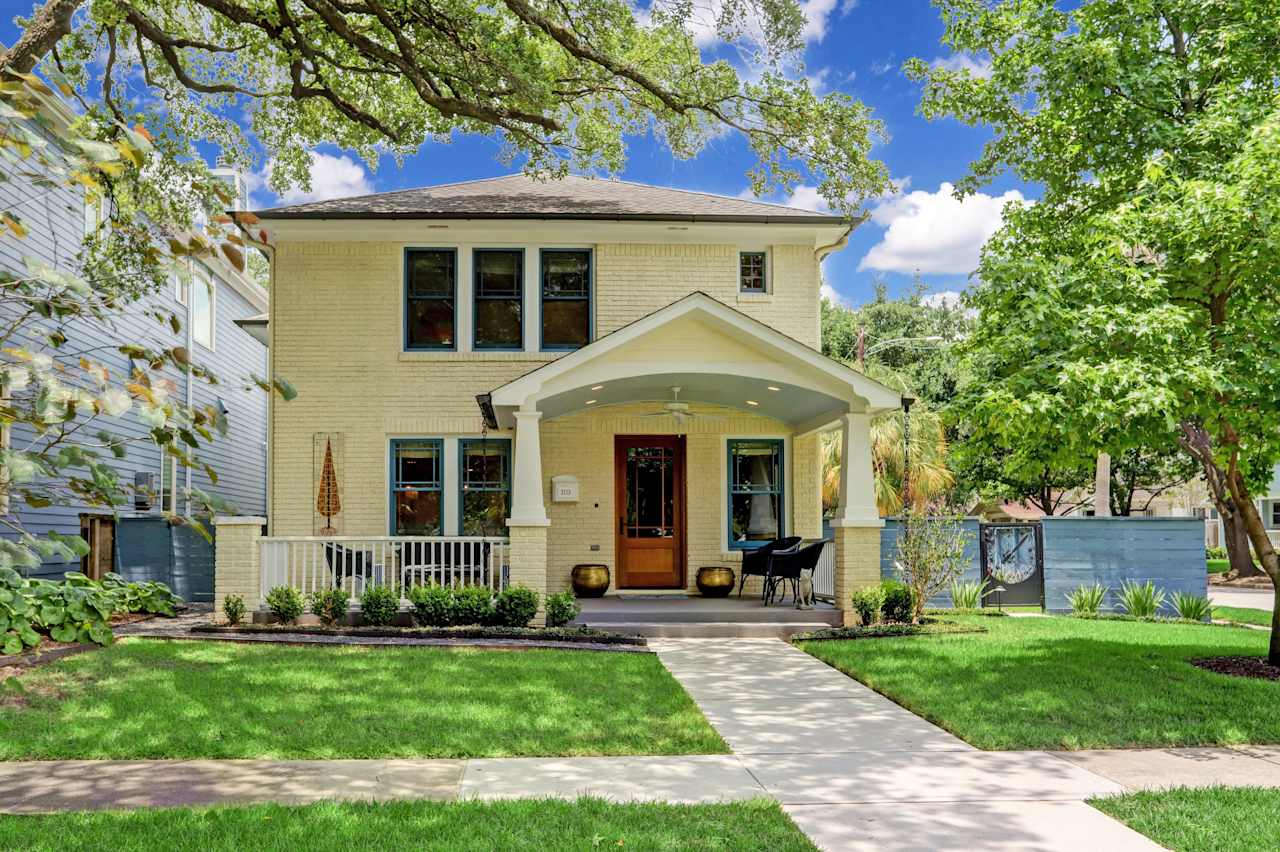
- Montrose, Museum District, Midtown. A mix of renovated bungalows, townhomes, and condos with strong access to culture and dining.
- Heights and Greater Heights. Historic homes, active infill, and street-by-street variations in PPSF based on age, renovations, and lot.
- Rice Military and Washington Corridor. Newer infill and townhomes near nightlife and employment corridors.
- EaDo, Near Northside, Third Ward. Rapidly changing areas with varying PPSF by pocket and property type.
Suburban comparison set
- The Woodlands. A master-planned community with a broad range of homes and larger average lots.
- Sugar Land and Missouri City. Master-planned communities with a wide mix of neighborhoods and price points.
- Katy. Significant new-build inventory and proximity to major employment centers in the Energy Corridor.
- Pearland. Newer homes and larger lots relative to many Inner Loop options.
- Cypress, Tomball, and Cypress Creek. Varied product types and sizes across a wide price spectrum.
- Bay Area, Clear Lake, and League City. Markets influenced by nearby technology and medical employers.
How to compare PPSF the right way
A clean process keeps your analysis accurate and fair.
- Define your markets and time window
- Select 4 to 6 Inner Loop micro-markets and 4 to 6 realistic suburban alternatives based on your price band, commute, and property type.
- Use recent closed sales. In a faster market, focus on 3 to 6 months. In a slower market, extend to 12 months.
- Filter by property type and size
- Separate single-family homes, townhomes, and condos. Do not mix them in one PPSF set.
- Compare homes within plus or minus 10 to 20 percent of the target square footage.
- Compute and summarize PPSF
- Calculate median PPSF. Medians are less affected by outliers than averages.
- Note the range and any outliers, such as teardown transactions or multi-parcel sales that distort the picture.
- Annotate the crucial differences
- Lot size and shape, garage and outbuildings, pool, and outdoor improvements.
- Year built and renovation level, including mechanical systems and roof.
- Flood zone, elevation, and any known flood history.
- Bedroom and bathroom count and the functionality of the layout.
- School zone boundaries and proximity to employment centers.
- Write a short narrative
- Explain why certain comps are included or excluded.
- Clarify whether you adjusted for lot premiums, renovation quality, or flood risk.
What PPSF can and cannot tell you
PPSF is a useful starting point. It helps you quickly spot homes that are out of line with similar recent sales and compare neighborhoods at a high level. It also highlights the land-value tradeoff you make to live closer in.
But PPSF is not a standalone valuation tool. It does not capture lot value, layout efficiency, outdoor space, floods, or the quality of systems and finishes. Avoid comparing different property types using PPSF alone. Townhomes and condos often show very different patterns from single-family homes.
Buyer strategies that work
- Start with PPSF to map neighborhoods that fit your budget and space needs. Then drill down to verify the square footage source and what is included in living area.
- Walk the lot and study the systems. Look at roof, plumbing, electrical, and HVAC. An attractive PPSF can hide costly maintenance that will show up later.
- Check flood exposure. Review FEMA and other flood risk resources and seek any available claim history. Insurance costs and peace of mind matter.
- Consider total cost, not just PPSF. Taxes, insurance, homeowner association dues if applicable, and commute costs all affect what you can comfortably afford.
- If you are open to projects, analyze the land value implied by the PPSF of smaller, older properties. In some Inner Loop pockets, you are primarily paying for land and location.
Seller strategies to price with confidence
- Use neighborhood PPSF as a starting benchmark. Then adjust for renovations, lot size, location within the neighborhood, and any flood considerations.
- Present a tight set of comps that match your home’s size band and property type. Note upgrades and improvements so buyers see how your price aligns with value.
- If your home has distinctive features, such as a larger lot, a historic designation, or a high-end renovation, expect to diverge from a raw neighborhood PPSF. Support your price with carefully chosen comps and clear explanations.
- Keep your time window recent. In a changing market, 3 to 6 months of sales are often more telling than a full year.
A quick checklist before you rely on PPSF
- Square footage source confirmed and consistent across comps.
- Property type aligned across comps: detached, townhome, or condo.
- Size band within plus or minus 10 to 20 percent of your target home.
- Lot size, shape, and outdoor improvements noted separately.
- Year built and major renovations documented.
- Flood zone, elevation, and any flood history flagged.
- Bedrooms, bathrooms, and layout efficiency compared.
- School zone and proximity to key job centers noted.
- Comps window disclosed: 3, 6, or 12 months, with sample size.
- Outliers removed or clearly explained.
Putting it together for your move
When you compare Inner Loop and suburban options through the PPSF lens, you are really weighing how much you value location, walkability, and time versus larger interior space and lot size. There is no one right answer, only the right fit for you. Ground your decision in clean comps, clear adjustments, and a realistic understanding of ongoing costs.
If you want a confident, data-backed plan for buying or selling in West University, River Oaks, Southampton, Braes Heights, or a nearby Inner Loop neighborhood, you do not have to piece it together alone. Connect with a local advisor who studies these micro-markets daily and will tailor the analysis to your goals.
Ready to compare neighborhoods, refine your comps, and price with precision? Reach out to Gayle G. Kennedy to request a complimentary home valuation & consultation.
FAQs
What is price per square foot and how is it calculated?
- PPSF equals the sale price divided by finished living area, excluding garages and unfinished spaces, and is best used alongside comparable sales.
Why is PPSF typically higher inside Houston’s 610 Loop?
- Close-in neighborhoods have land scarcity, stronger walkability and amenities, redevelopment demand, and location premiums that push PPSF up.
Why do Houston suburbs often show lower PPSF?
- Suburban homes tend to be larger on bigger lots with more standardized finishes, which spreads total price over more square footage.
Can I compare condos and single-family homes by PPSF?
- Not directly; condos often have higher PPSF and different carrying costs, so compare within the same property type for meaningful insights.
How should flood risk factor into a PPSF comparison in Houston?
- Flood risk can materially change pricing; always check flood zones and any known history, and adjust your comps and expectations accordingly.
What is the best time window for comps in a shifting market?
- Use 3 to 6 months in a faster market and up to 12 months in a slower one, and always note the sample size and any outliers you excluded.